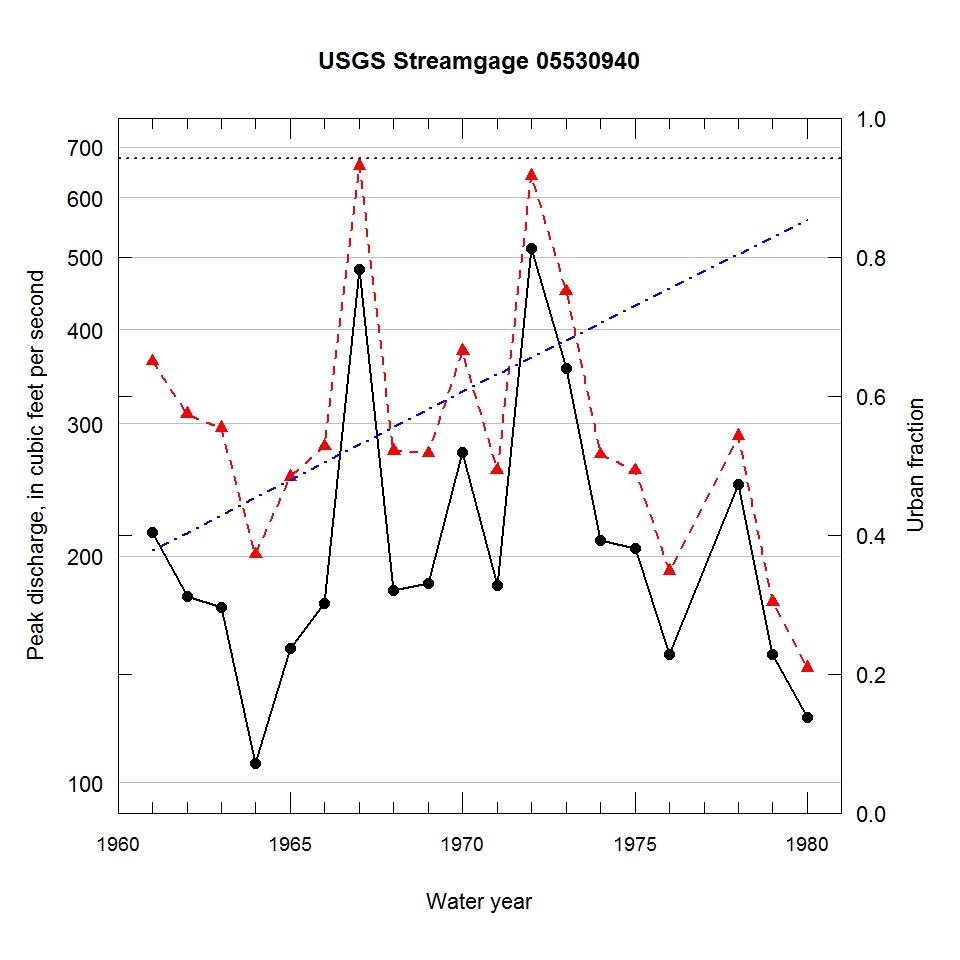
Observed and urbanization-adjusted annual maximum peak discharge and associated urban fraction and precipitation values at USGS streamgage:
05530940 SALT CREEK AT PALATINE, IL


| Water year | Segment | Discharge code | Cumulative reservoir storage (acre-feet) | Urban fraction | Precipitation (inches) | Observed peak discharge (ft3/s) | Adjusted peak discharge (ft3/s) | Exceedance probability |
| 1961 | 1 | -- | 0 | 0.377 | 1.273 | 215 | 363 | 0.192 |
| 1962 | 1 | -- | 0 | 0.403 | 0.269 | 177 | 309 | 0.341 |
| 1963 | 1 | -- | 0 | 0.428 | 2.012 | 171 | 296 | 0.390 |
| 1964 | 1 | -- | 0 | 0.454 | 0.901 | 106 | 201 | 0.764 |
| 1965 | 1 | -- | 0 | 0.479 | 0.010 | 151 | 255 | 0.539 |
| 1966 | 1 | -- | 0 | 0.505 | 1.231 | 173 | 280 | 0.449 |
| 1967 | 1 | -- | 0 | 0.530 | 1.229 | 482 | 661 | 0.021 |
| 1968 | 1 | -- | 0 | 0.555 | 4.153 | 180 | 276 | 0.463 |
| 1969 | 1 | -- | 0 | 0.581 | 2.462 | 184 | 274 | 0.469 |
| 1970 | 1 | -- | 0 | 0.606 | 2.872 | 275 | 375 | 0.179 |
| 1971 | 1 | -- | 0 | 0.631 | 0.386 | 183 | 260 | 0.523 |
| 1972 | 1 | -- | 0 | 0.656 | 1.751 | 513 | 641 | 0.025 |
| 1973 | 1 | -- | 0 | 0.680 | 2.202 | 356 | 450 | 0.095 |
| 1974 | 1 | -- | 0 | 0.705 | 1.131 | 210 | 273 | 0.475 |
| 1975 | 1 | -- | 0 | 0.730 | 1.851 | 205 | 260 | 0.521 |
| 1976 | 1 | -- | 0 | 0.754 | 1.891 | 148 | 191 | 0.801 |
| 1978 | 1 | -- | 0 | 0.804 | 2.202 | 249 | 289 | 0.417 |
| 1979 | 1 | -- | 0 | 0.828 | 0.380 | 148 | 174 | 0.857 |
| 1980 | 1 | -- | 0 | 0.853 | 0.951 | 122 | 142 | 0.940 |

